As someone deeply passionate about forex trading, we bet you’re always keen to discover tools to help you navigate the dynamic realm of currency exchange. Ever stumbled upon the Fibonacci retracement tool and wondered about its magic in refining your trade approach? Don’t fret; we’ve been there and we’re eager to journey with you.
The Fibonacci retracement tool, based on the enigmatic Fibonacci sequence or number, can be a powerful ally in your trading toolbox. It’s a trusted tool for traders across the globe, but you might wonder: what’s behind it, and how does it gel with the world of forex trading?
We get it; things might seem a tad overwhelming. But don’t you worry! In this article, we’re laying things out piece by piece, especially for you. So, let’s go through the journey of this intriguing concept, and see how it might reshape the way you trade.
What is the Fibonacci Sequence or Number?
Starting with the simple numbers – zero and one, the Fibonacci sequence represents a series of numbers in which each next number is the sum of the two preceding ones. It is the first number of a series that continues with 0, 1, 1, 2, 3, 5, 8, 13, 21, 34, etc. Despite its seeming simplicity, this pattern is extremely significant, showing up not only in nature’s design but also in architectural patterns, the arts, and most intriguingly, forex trading.
The Golden Ratio and Forex Trading - How Fibonacci Retracement Works
In the realm of forex trading, the Fibonacci retracement tool finds an essential place due to the profound impact it can have on identifying potential turning points in the price trend. The entire concept hinges on the fascinating mathematical concept known as the ‘Golden Ratio’.
First, though, a quick lesson on the Golden Ratio before we go into its forex applications. Mathematically, the golden ratio occurs when the ratio of two numbers is the same as the ratio of the sum of the numbers to the greater of the two numbers. The Golden Ratio is roughly 1.618, and its numerical representation is the Greek letter phi ().
So, how does this play into the Fibonacci retracement levels in trading? Here’s how:
Fibonacci Retracement Levels
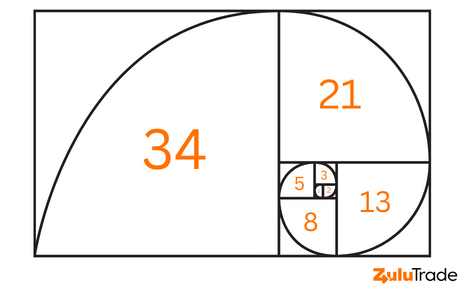
When you take any two successive numbers in the Fibonacci sequence, their ratio is approximately 1.618 or the inverse, 0.618. For example, 34 divided by 21 equals approximately 1.618, and 21 divided by 34 equals approximately 0.618.
These ratios are used to derive the primary Fibonacci retracement levels: 23.6%, 38.2%, 50%, 61.8%, and 100%.
Here’s how each percentage is derived:
- 23.6% Level: This is derived from dividing a number in the sequence by the number three places to the right. For example, 89 divided by 377 equals approximately 0.236 or 23.6%.
- 38.2% Level: This is derived from dividing a number in the sequence by the number two places to the right. For example, 89 divided by 233 equals approximately 0.382 or 38.2%.
- 50% Level: While not an official Fibonacci ratio, the 50% level is often included in Fibonacci retracement drawings. Traders widely regard it as a significant potential reversal level.
- 61.8% Level: This is derived from dividing a number in the sequence by the number immediately to the right. For example, 89 divided by 144 equals approximately 0.618 or 61.8%.
- 100% Level: This level represents the full retracement of the price – in essence, the point from which the initial price movement began.
These percentages, once identified, are used to plot horizontal lines on the price chart to indicate potential ‘support’ and ‘resistance’ levels.
Support and Resistance
In trading terminology, ‘support’ refers to a price level where a sufficient number of buyers enter the market to halt the price from falling further. Conversely, ‘resistance’ is a price level at which a large number of sellers enter the market, stopping the price from rising further. Traders often use support and resistance levels to help decide their entries and exits.
By identifying these Fibonacci retracement levels, forex traders can better predict potential turning points to capitalize on market movements. As the price of a currency pair retraces to these levels, traders watch the market action closely for signs of a reversal. The effectiveness of the Fibonacci retracement tool hinges on these levels and the trader’s ability to interpret their implications accurately.
This integral understanding of the Fibonacci retracement tool is the stepping stone to applying it successfully in forex trading strategies. And while it may sound complex at first, a little practice goes a long way in mastering its use.
How to Draw Fibonacci Retracement Levels - Practical Application
Now that we understand the underlying theory, let’s delve into the practical application of the Fibonacci retracement tool. The tool is typically available on most trading platforms and is easy to use once you get the hang of it.
Here’s a step-by-step guide on how to draw Fibonacci retracement levels:
Using Fibonacci in an Uptrend
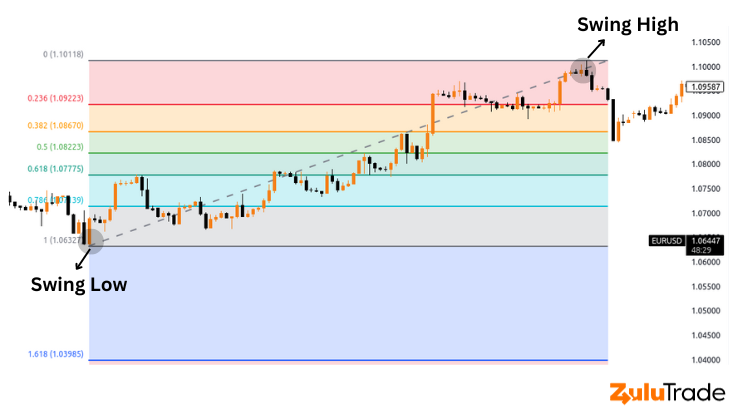
- Identify the Swing Points: Start by identifying the most recent significant swing low and swing high on the chart. The swing low is the lowest point that the price reaches before moving upwards, while the swing high is the highest point the price reaches before pulling back.
- Draw the Fibonacci Levels: Once the swing low and high are identified, you’ll draw a vertical line from the lowest point (swing low) to the highest point (swing high). You do this by selecting the Fibonacci retracement tool on your trading platform, clicking on the swing low, and dragging the cursor to the swing high. The tool will then automatically plot the key Fibonacci retracement levels of 23.6%, 38.2%, 50%, 61.8%, and 100% on the chart.
Using Fibonacci in a Downtrend
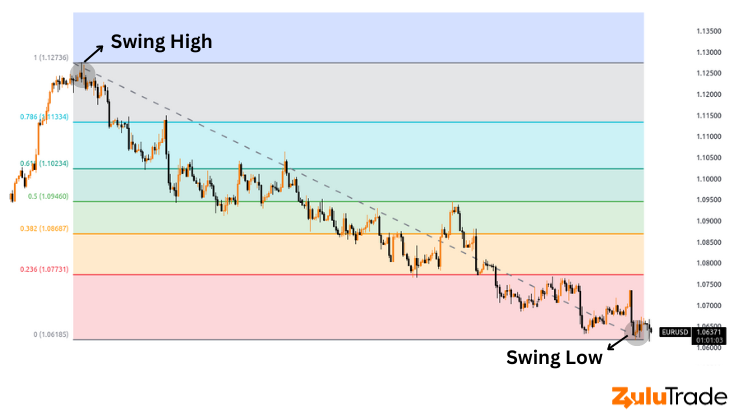
The process is similar to an uptrend but reversed. Here’s how:
- Identify the Swing Points: In a downtrend, you need to find the most recent significant swing high and swing low. The swing high is the peak the price reaches before turning downwards, and the swing low is where the price drops before rebounding.
- Draw the Fibonacci Levels: After identifying the swing high and low, draw a vertical line from the highest point (swing high) to the lowest point (swing low). To do this, select the Fibonacci retracement tool on your trading platform, click on the swing high, and drag the cursor to the swing low. The tool will then plot the Fibonacci retracement levels on your chart.
The resulting levels in both cases represent potential areas where the price could retrace before continuing the trend. The effectiveness of these levels as potential support or resistance will often depend on the overall market conditions, the currency pair you’re trading, and other technical factors.
Remember, practice makes perfect. The more you work with Fibonacci retracement levels, the more confident you’ll become in identifying key levels and making more informed trading decisions. A practical way to start is by analyzing historical data and observing how prices reacted at these Fibonacci levels. Once you’re comfortable with this, you can start incorporating it into your real-time trading strategy.
Forex Strategies by Traders Using Fibonacci Levels
Fibonacci retracement levels are more than just lines on a chart – they are strategic markers that traders use to develop their forex trading strategies. Here, we’ll explore some of the common ways that traders utilize Fibonacci levels to make more informed decisions.
1. Entry Point Strategy
One primary way traders use Fibonacci levels is to determine potential entry points in the market. Traders anticipate that a price will retrace to a Fibonacci level before resuming the direction of the original trend. Hence, they aim to enter the market at these retracement levels, anticipating a price bounce.
For example, if the GBP/USD currency pair is in an uptrend and retraces to the 38.2% Fibonacci level before showing signs of resuming its upward trajectory, traders might choose to buy at this level, anticipating that the price will bounce back and continue its initial upward trend.
2. Stop-Loss and Take-Profit Strategy
Fibonacci retracement levels also come in handy in setting stop-loss and take-profit levels. A stop-loss order is designed to limit a trader’s loss on a trade, whereas a take-profit order lets the trader lock in a profit once the trade reaches a certain level.
For instance, a trader might place a stop-loss order just below the 50% Fibonacci retracement level if they’ve entered a long trade at the 38.2% level. This way, they can limit their losses if the price fails to bounce at the 38.2% level and continues to fall instead. For the take-profit level, a trader might target the 0% Fibonacci level (the initial high point before the retracement) or even aim for a Fibonacci extension level, which projects potential levels the price could reach after resuming the original trend.
3. Combining Fibonacci Levels with Other Indicators
Finally, many traders combine Fibonacci retracement levels with other technical analysis tools to validate their trading decisions further. This practice is known as ‘confluence’ and can increase the effectiveness of the Fibonacci tool.
For example, a trader might look for a situation where a Fibonacci retracement level aligns with a significant support or resistance level identified by other means, like trend lines or moving averages. If the price reaches this level and an oscillator like the Relative Strength Index (RSI) also indicates an overbought or oversold condition, the trader might consider this as a strong signal to enter a trade.
These are just a few examples of how traders can harness the power of Fibonacci retracement levels in their forex trading strategies. However, remember that these strategies don’t guarantee success – they merely increase the probability of making successful trades. It’s crucial to combine these strategies with sound risk management practices and continuous learning to achieve long-term success in forex trading.
Fibonacci Retracement with Support and Resistance
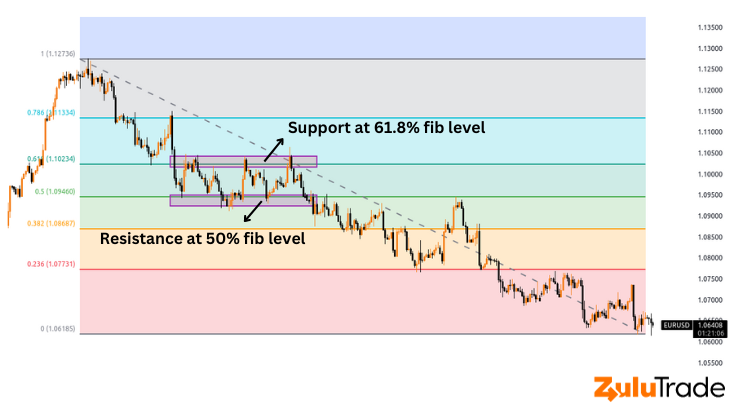
While Fibonacci retracement levels are useful in their own right, they can be significantly more effective when used in conjunction with support and resistance levels. These levels are areas where the price has historically had difficulty breaking through. When a Fibonacci retracement level coincides with a pre-established support or resistance level, it is commonly referred to as a ‘confluence,’ which can be a very strong indication that the price may react at this level.
Identifying Support and Resistance Levels
Before you can utilize confluence, you need to be able to identify support and resistance levels. These are usually areas where the price has repeatedly failed to move higher (resistance) or lower (support).
To identify these levels, follow these steps:
- Look for areas on your chart where the price has made at least two attempts to move higher or lower but failed each time.
- Draw a horizontal line at these levels.
It’s important to remember that support and resistance levels are not exact prices but rather areas. So, it’s best to draw these lines with a certain thickness to indicate this.
Combining Fibonacci with Support and Resistance
Once you have identified your support and resistance levels and drawn your Fibonacci retracement, it’s time to look for areas of confluence. These are areas where a Fibonacci retracement level and a support or resistance level are at the same price.
Let’s say you have identified a resistance level at 1.2050 on the EUR/USD pair. You then draw your Fibonacci retracement and find that the 61.8% retracement level also falls at 1.2050. This is an area of confluence that may act as a strong level of resistance.
When the price approaches this area, you can look for signs of a reversal, such as a candlestick pattern or an indicator signal. If you see one, this may be a good time to open a sell position, with a stop-loss above the resistance level and a take-profit at the next Fibonacci level or support level.
Remember, as with all trading strategies, combining Fibonacci retracement with support and resistance doesn’t guarantee success, but it does increase the probability of a successful trade. Always manage your risk and never risk more than you can afford to lose.
Use Fibonacci to Place Your Stoploss Level
Risk management is a crucial aspect of successful trading, and placing a stop-loss order is an effective way to limit potential losses on a trade. A stop-loss order causes a trade to be terminated automatically if the price reaches a predetermined threshold. If the market turns against you, this can limit the damage.
Fibonacci retracement levels provide logical and strategic places to set your stop-loss orders. Here’s how you can use Fibonacci levels to determine where to place your stop loss:
Setting Stop-Loss in an Uptrend
If you’re going long (buying) in an uptrend, a common practice is to place your stop-loss order just below the Fibonacci retracement level where you entered the trade.
Let’s say you entered a trade at the 50% retracement level, expecting the price to bounce off and continue its uptrend. You can place your stop-loss order just below the 61.8% retracement level. The logic is that if the price drops below this level, the trend you’re betting on has potentially reversed, so it makes sense to exit the trade and limit your losses.
Setting Stop-Loss in a Downtrend
If you’re going short (selling) in a downtrend, the stop-loss order should be set just above the Fibonacci retracement level where you entered the trade.
For instance, if you entered the trade at the 38.2% retracement level, expecting the price to bounce off this level and continue its downtrend, you can set your stop-loss order just above the 50% level. This way, if the price rises above this level, it indicates that the trend you’re betting on might have reversed.
By using Fibonacci retracement levels to set your stop-loss orders, you’re basing your decision on the market’s inherent dynamics, providing a more informed and strategic way to limit your risk. However, keep in mind that no method is foolproof. The markets can always behave unpredictably, so it’s vital to use stop-loss orders as part of a comprehensive trading strategy that also includes sound money management rules.
How Accurate is Fibonacci Retracement in Forex?
Fibonacci retracement is a popular tool among traders and is used globally to identify potential trading opportunities. However, as with all trading tools, it’s essential to understand that while Fibonacci retracement can be helpful, it’s not 100% accurate all the time.
The accuracy of Fibonacci retracement in predicting where a price may find support or resistance varies due to a number of factors. These include the currency pair being traded, the timeframe, and the overall market conditions. The degree of accuracy can also depend on the trader’s skill in correctly identifying significant swing highs and lows from which to draw the Fibonacci levels.
One way to improve the accuracy of the Fibonacci retracement tool is to use it in conjunction with other technical analysis tools or indicators. For instance, traders often look for confirmation from candlestick patterns or use other indicators like the Relative Strength Index (RSI) or Moving Average Convergence Divergence (MACD) to validate the potential reversals at Fibonacci levels. Another method is to use Fibonacci retracement levels with price action patterns, like support and resistance, trend lines, or chart patterns.
Remember, the market is influenced by a multitude of factors, including economic data releases, geopolitical events, and investor sentiment, which Fibonacci retracement doesn’t account for. Hence, it’s advisable to use this tool as part of a broader trading strategy that includes fundamental analysis and risk management practices.
Fibonacci Retracements are NOT Foolproof
While Fibonacci retracements can provide valuable insights and enhance your trading decisions, it’s important to remember that they are not foolproof. The financial markets are complex and influenced by a multitude of factors. No single tool or indicator can predict market movements with absolute certainty.
Fibonacci retracements provide potential levels where price reversals may occur, but they do not offer any guarantees. Sometimes, the price may ignore Fibonacci levels altogether and move in the opposite direction than expected. Other times, it may stop and reverse exactly at a Fibonacci level.
That’s why it’s crucial to use Fibonacci retracements as part of a comprehensive trading strategy that includes other technical analysis tools, fundamental analysis, and solid risk management practices. Also, practice and experience are key. The more you use Fibonacci retracements and analyze their effectiveness in different market conditions, the more adept you’ll become at leveraging them in your trading.
Summing up!
The Fibonacci retracement tool, while simple to understand, offers powerful insights for those engaged in forex trading. By providing predictive support and resistance levels, it facilitates more strategic trade entries and exits. Though it isn’t a guarantee of success, understanding and properly applying this tool can significantly improve your forex trading endeavors. After all, even in the unpredictable world of trading, the Fibonacci sequence finds a way to provide some order. Happy trading!
Frequently Asked Questions (FAQs)
1. How does Fibonacci retracement differ from other technical analysis tools in forex trading?
Fibonacci retracement is a unique tool in forex trading that helps identify potential levels of support and resistance based on the Fibonacci number sequence. It’s different from other tools as it takes into consideration the natural and mathematical relationships between numbers, which is believed to also apply to financial markets.
2. Can beginners in forex trading effectively use the Fibonacci retracement tool?
Yes, even beginners can use the Fibonacci retracement tool, but it requires understanding and practice. The tool is straightforward to apply once you understand the principles behind the Fibonacci sequence and how these numbers relate to financial markets.
3. What are some common mistakes traders make when using Fibonacci retracement in forex trading?
Some common mistakes include drawing the Fibonacci levels incorrectly, relying solely on Fibonacci retracement for trading decisions without considering other market factors or indicators, and not using proper risk management practices when trading at these levels.
4. Are Fibonacci retracement levels more effective in certain market conditions?
The effectiveness of Fibonacci retracement levels can vary with different market conditions. They are often more effective in trending markets, where prices are making clear swings and retracements. In a range-bound or choppy market, Fibonacci retracements might not be as reliable.
