Jumping into the world of Forex trading can feel a bit like stepping into uncharted territory. Those charts with their lines, bars, and candlesticks might seem like a secret code only the pros can crack. But here’s some reassurance for you – understanding how to read Forex charts is less complicated than it appears.
In fact, a Forex chart is simply a tool to help traders like you track and predict currency market trends. Consider these charts as a record depicting the performance of one currency in relation, to another over a period of time. Whether it’s the Euro against the USD or the British pound against the Japanese yen, these charts help you follow the story of the currency market.
If you are curious, about how to interpret charts and determine the moments, for buying or selling then you have come to the right place. To help you feel comfortable placing your first trade, we’ll break down all the information you need to know about forex charts in this article.
Alright get ready. Let’s jump in. The exciting world of Forex trading is waiting for us!
Navigating the world of foreign exchange, or Forex, can seem daunting at first, especially when it comes to reading forex charts. Trust me, once you dive in and get a feel for it, it’s not as tricky as it first looks. We will explain how to read forex charts in this article. By the end, you will have the knowledge and confidence to successfully execute your trade in this market.
Understanding What is a Forex Chart
To put it simply, a Forex chart is a tool that traders use to track and predict changes in different currency pairs. You know how you use a map when you’re trying to figure out a new city? That’s kind of how a Forex chart works for traders. Instead of streets and landmarks, this map shows us the ups and downs of currencies over time. Like, if you pull up a EUR/USD chart, it’s giving you the lowdown on how the Euro’s been doing compared to the US dollar.
Different Types of Forex Charts

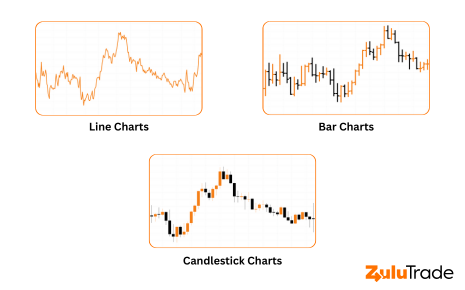
Just like there are many different types of maps, there are also different types of Forex charts. The three most common types are line charts, bar charts, and candlestick charts.
- Line Charts: These are the simplest type of chart. They connect closing prices over a certain period, creating a ‘line’ that shows overall price movement.
- Bar Charts: These are a bit more detailed. Each ‘bar’ shows the opening and closing prices, as well as the highs and lows during the period.
- Candlestick Charts: These are the most popular type of Forex chart. They show the opening, closing, high, and low prices, like bar charts. But, they also use color-coding to show whether prices increased or decreased during the period.
Unraveling the Forex Charts and Time Frames
Forex charts can be set to various time frames, depending on your trading strategy. Do you know how we measure time in various chunks? Like, there’s the one minute (M1) view, the five-minute glance (M5), or maybe the fifteen-minute perspective (M15). Some folks even go as broad as looking at daily (D1), weekly (W1), or monthly (MN) trends.
Those are the go-to timeframes for many of us.
A shorter time frame like M1 or M5 might be used by day traders who make quick, small trades. A longer time frame like D1 or W1 might be used by long-term investors who are looking for larger trends.
Breaking Down a Candlestick: What's What
Let’s delve a little deeper into the most popular type of chart – the candlestick chart. Each ‘candlestick’ represents a specific time period and shows the opening, closing, high, and low prices for that period.
The ‘body’ of the candlestick represents the range between the opening and closing prices, while the ‘wick’ represents the high and low prices. If the closing price is greater than the opening price, as represented by a green or white candlestick, this indicates an upward trend. If the price drops from where it started, that candlestick usually ends up looking black or red. Just a heads up!
How to Read Forex Charts and When to Buy or Sell
Reading forex charts and deciding when to buy or sell can seem complex, but remember, it’s about spotting patterns and trends.
If you see a pattern where the price is generally going up, this is called an ‘uptrend’. If the price is generally going down, it’s called a ‘downtrend’. If the price isn’t moving much in either direction, it’s called a ‘sideways trend’ or ‘ranging market’.
Traders usually aim to buy in an uptrend and sell in a downtrend. But, be aware that many factors can affect currency prices, and trends can change quickly. Always double-check and take in the full picture before settling on a choice.
What's the Go-To Chart for Forex Traders?
While it ultimately depends on your personal trading style and goals, many traders consider candlestick charts the best for Forex trading. They really lay out the nitty-gritty of price shifts in a way that’s easy on the eyes, so you can easily read forex charts and catch those trends and patterns.
Wrapping it up, and getting the hang of Forex charts feels a bit like picking up a new language. It may seem complex at first, but with practice and patience, you’ll soon be able to ‘speak Forex’ fluently. Happy trading!
FAQs
Do I need special software to view Forex charts?
No, you don’t need any special software. Most online trading platforms provide Forex charts as part of their service. These platforms offer various chart types and tools to analyze market trends.
Can I use Forex charts for any currency pair?
Yes, Forex charts can be used for any currency pair available in the trading platform. You can analyze and compare performance between different currencies such as the U.S. Dollar (USD), Euro (EUR), British Pound (GBP), and many more.
Can Forex charts predict the future performance of a currency?
Forex charts can’t guarantee future performance. These are a bit like history lessons. They won’t tell you the future, but they’ll show you what’s happened before. Traders use them to identify trends and patterns that may indicate possible future movements. But currencies are tricky, and influenced by a lot of factors. So, always use charts as just one part of your bigger game plan.
Are there any resources where I can learn more about reading Forex charts?
Absolutely! There’s a lot of stuff out there, especially for folks just starting to wrap their heads around Forex charts. Think online tutorials, educational websites, trading forums, and even social media groups where folks share their two cents. Books on Forex trading can also be helpful. Always make sure to vet your sources for credibility and reliability.
